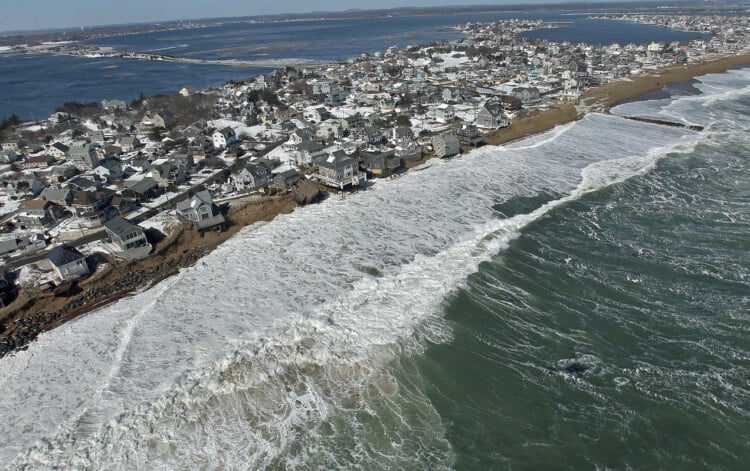
A water level of 1.0 meters above the high tide line could be reached through combinations of sea level rise, tides, and storm surge due to climate change,
This map of places 1m underwater in 30 years should terrify you.
— Russ Jones (@RussInCheshire) October 17, 2022
https://t.co/we5jlUoeOP pic.twitter.com/01j0JYICi4
You can check out the map for yourself, here.
Map Overview
Climate Central’s sea level rise and coastal flood maps are based on peer-reviewed science in leading journals. As these maps incorporate big datasets, which always include some error, these maps should be regarded as screening tools to identify places that may require deeper investigation of risk.
Outside of the United States, maps are based on global-scale datasets for elevation and tides in addition to sea level rise projections. For the 50 U.S. states, more accurate but still imperfect data are used.
Areas lower than the selected water level and with an unobstructed path to the ocean are shaded red. By default, areas below the water level but that appear to be protected by ridges (and in the U.S., levees) are not shaded.
Our approach makes it easy to map any scenario quickly and reflects threats from permanent future sea-level rise well. However, the accuracy of these maps drops when assessing risks from extreme flood events. Our maps are not based on physical storm and flood simulations and do not take into account factors such as erosion, future changes in the frequency or intensity of storms, inland flooding, or contributions from rainfall or rivers.


